
During my time as a healthcare market researcher I’ve learned that there are three key business questions that are critical to marketing success:
- Which product features drive the prescribing of a product?
- Which are the most important factors that influence likelihood to use a product that’s soon to be launched?
- Finally, what factors drive brand satisfaction and consumer loyalty?
If you can confidently answer these questions then you’re on the road to success. The good news – there’s an analytical process that answers all these questions.
What is key driver analysis?
Key driver analysis (KDA) is a term for statistical analysis that tells you the derived importance between potential drivers (independent variables) and customer behavior (the dependent variable). For example – which product features (independent variable) influence product prescribing (dependent variable)?
In quantitative research, measuring stated importance is one way to understand what may drive a healthcare providers’ (HCP) or consumers’ behavior. We most often do this by asking respondents within the online survey to rate a series of attributes on a scale, such as an Interval, Likert or Semantic Differential scale (MaxDiff) which provides us with a snapshot of what factors are important to them.
However, what people say they do doesn’t always match up with what they actually do. And two factors may be considered equally important on a scale of 1-10. However, in a real-world setting, one factor will usually carry more weight over the other in driving a particular behavior (ie, positive efficacy vs. aesthetic packaging in product choice).
KDA overcomes these problems by deriving the importance of a list of attributes or features by comparing the importance of each of them relative to another. The most commonly used type of analysis is multiple linear regression, which has two main advantages when analyzing data.
The first is the ability to determine the relative influence of one or more independent variables on a dependent variable and the second is the ability to identify outliers, or anomalies.
The analysis works by running multiple correlations between a whole series of collected variables. These variables not only include ratings for how important each attribute is to a behavior as stated by the respondent; but also how the product/brand(s) perform overall on the behavior of interest and how the product/brand(s) perform in respect to these attributes.
The output of the KDA is then a percentage for how much each of the attributes explains any difference in the behavior in question.
Examples of key driver analysis
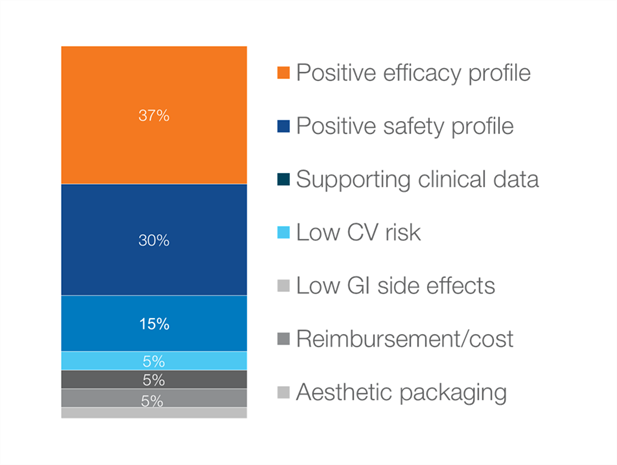
In the example below, the key driver to the product prescribing (IV/behavior) is positive efficacy, followed by positive safety and supporting clinical data.
Example: Derived importance of key drivers to prescribing choice:
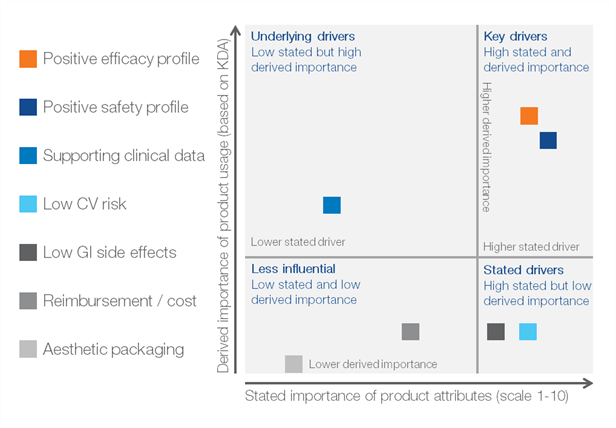
As I mentioned earlier, what people say they do and what they actually do can differ. Mapping the stated and derived importance of the attributes can identify not only the key drivers, but also the hidden drivers to particular behavior. A hidden driver may also be referred to as an unmet need, because a respondent may not state the attribute as being very important, but it does in fact influence their decisions.
These key drivers and hidden drivers provide a comprehensive view on motivators to behavior and can be used to guide key business decisions.
Example: Derived vs. stated importance of attributes to prescribing a product
Key driver analysis is a versatile tool that can be used in many different quantitative studies to answer key business questions. It is valuable FOR brand tracking studies to guide product positioning by identifying product strengths and unmet needs.
It can be used to identify the different drivers within a customer-based segmentation so that marketing materials and sales rep visits can be tailored to each segment. And for a pricing study, key driver analysis can help to understand the factors that increase a respondent’s willingness to pay.

Sign up to receive Rapport.
Rapport is our monthly newsletter where we share our latest expertise and experience.